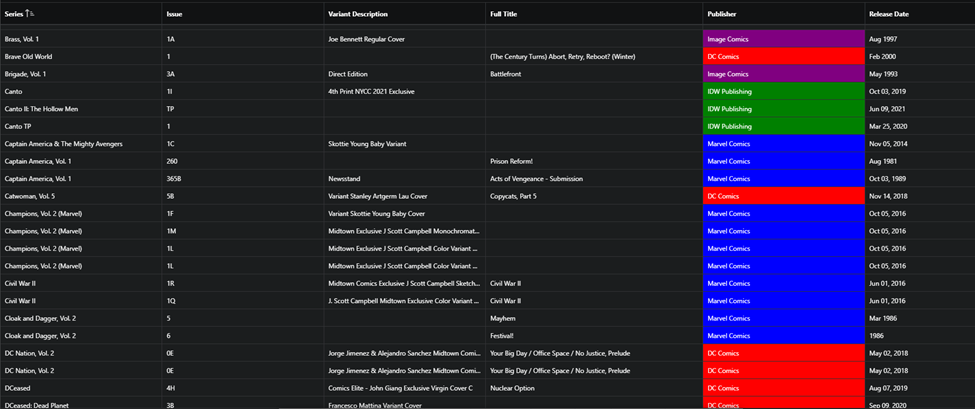
Sometimes you need to add some color to your grids. When sifting through your data, that color pop can add some visibility to your data. Color can add a quick view into what your data is saying. The best way to accomplish this in APEX is through some fairly basic JavaScript and CSS.
Highlighting Interactive Grid Cells
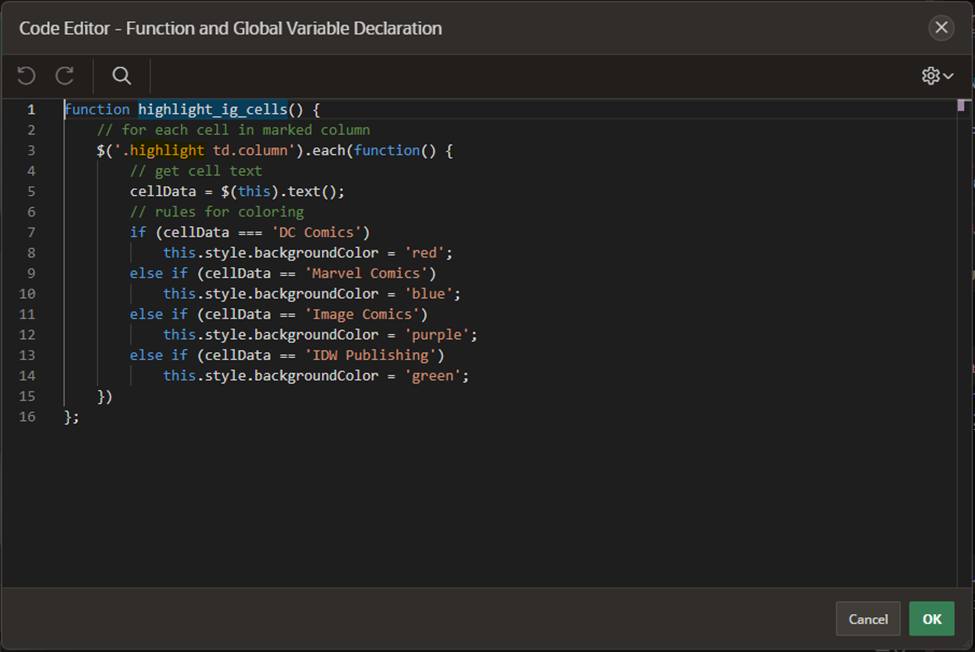
Start by adding this code to the Function and Global Variable Declaration.
function highlight_ig_cells() {
// Get the cells from the marked grid
$('.highlight td.column').each(function() {
// get the cell text
cellData = $(this).text();
// rules for coloring based on the cell text
if (cellData === 'DC Comics')
this.style.backgroundColor = 'red';
else if (cellData == 'Marvel Comics')
this.style.backgroundColor = 'blue';
else if (cellData == 'Image Comics')
this.style.backgroundColor = 'purple';
else if (cellData == 'IDW Publishing')
this.style.backgroundColor = 'green';
})
};
This will get the data from the marked cells. Now we will need to tell this function which cells to get.
First, we will add a CSS class to the grid itself. It will tell the function which grid to look at. This will be done on this line of code:
$('.highlight td.column').each(function()
We will want to add this ‘highlight’ tag to the CSS call on the Grid under Appearance.
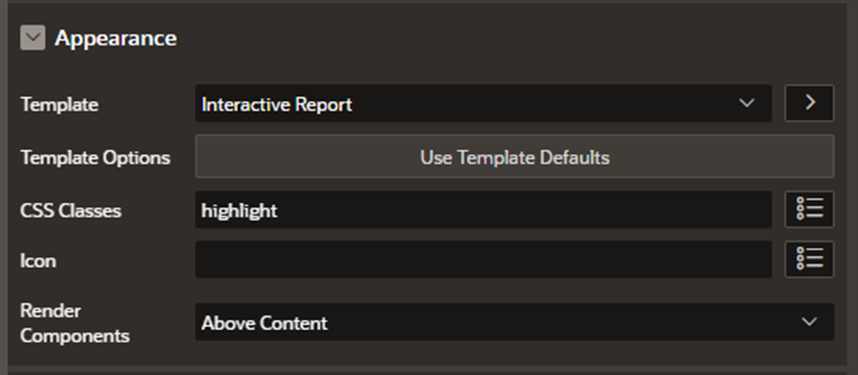
To mark the cell that you want to highlight, we look to the second part of the code above.
$('.highlight td.column').each(function()
We will want to mark the column in the same manner. This will be on the column in the Grid under Appearance as before.

Now that everything is marked, we will need to call the function. We are going to add this to the JavaScript Execute when Page Loads.

Now this will highlight when the page loads, but we need to add a dynamic action to handle when the grid loads more data. We will want to create one for Page Change [Interactive Grid] on the grid Region.
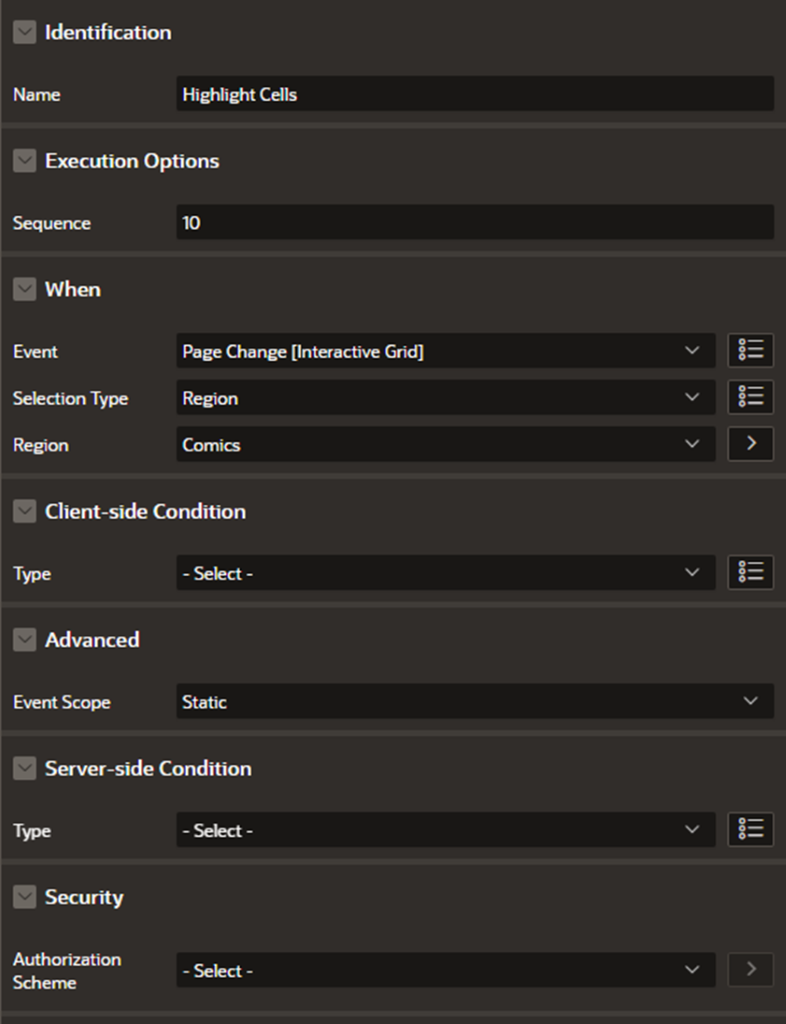
The True Action will be a JavaScript Expression to call that same highlight_ig_cells().
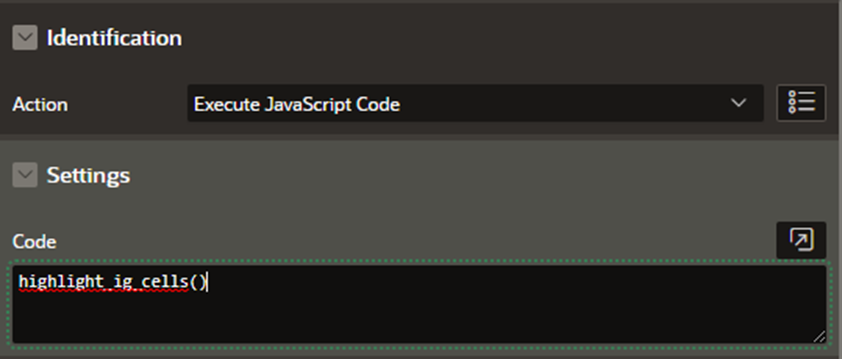
That will now highlight the cells based on the logic, even when the grid is refreshed or changed. This is a very simple and easy to maintain process that will give you and your users easy to read visual representations of your data.
SUBMIT YOUR COMMENT